Datadog Mule® Integration includes 5 dashboards and 9 monitors to visualize and identify the usage of your infrastructure resources. The data used in the dashboards and monitors is collected by the metrics.
Once you finalize the Datadog Mule® Integration installation, you will be able to check and use all dashboards and monitors in the Datadog page.
Dashboards:
- Execs: Cost optimization.
- Operations: Infrastructure.
- Operations: Resources allocation and usage.
- Operations: APIs
- Development: Optimizations.
Monitors:
- CloudHub and On-Premise.
- Applications stopped.
- CPU Load.
- Memory usage.
- On-Premise.
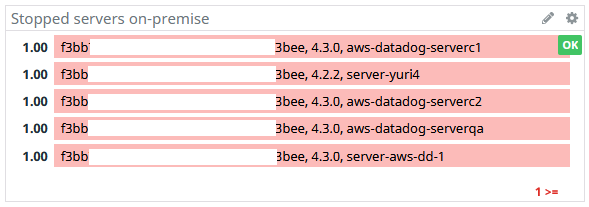
- Servers stopped.
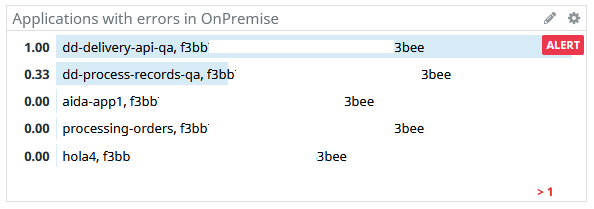
- Application errors.
- CloudHub.
- Queue overload.
Pre-requisites
Before using the dashboards, you must know the identifiers of the organization and environments. This will help to filter out the graphics in the dashboards as well as properly use the tags in the metrics.
MuleSoft has documented this in the following articles:
How to know my Organization ID (Org ID) on the Anypoint Platform
https://help.mulesoft.com/s/article/How-to-know-my-Organization-ID-Org-ID-on-the-Anypoint-Platform
How to get Anypoint platform organization details via Anypoint APIs
https://help.mulesoft.com/s/article/How-to-get-Anypoint-platform-organization-details-via-Anypoint-APIs
It’s recommended to save views in the dashboards where these identifiers are needed for proper visualization. Learn more about views here https://docs.datadoghq.com/dashboards/template_variables/#saved-views
Dashboards
Find the assets in the Datadog web page by clicking at the side bar: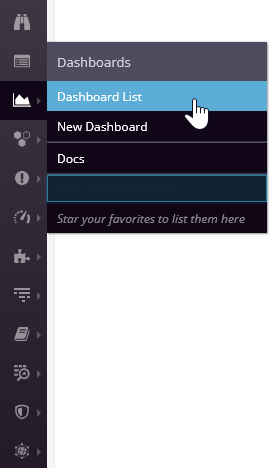
The Dashboard List should be like this one:
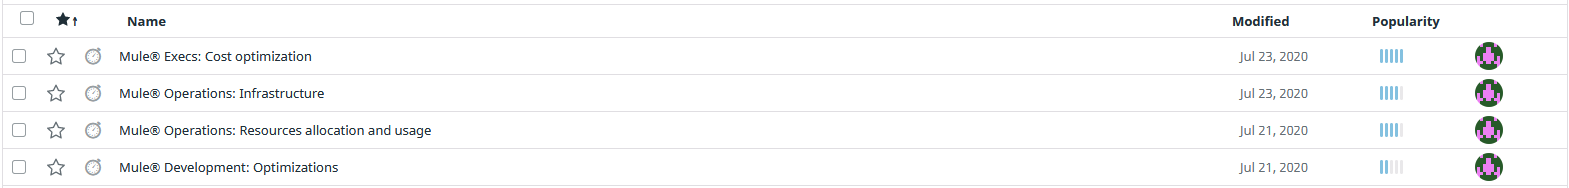
Let’s review how they work.
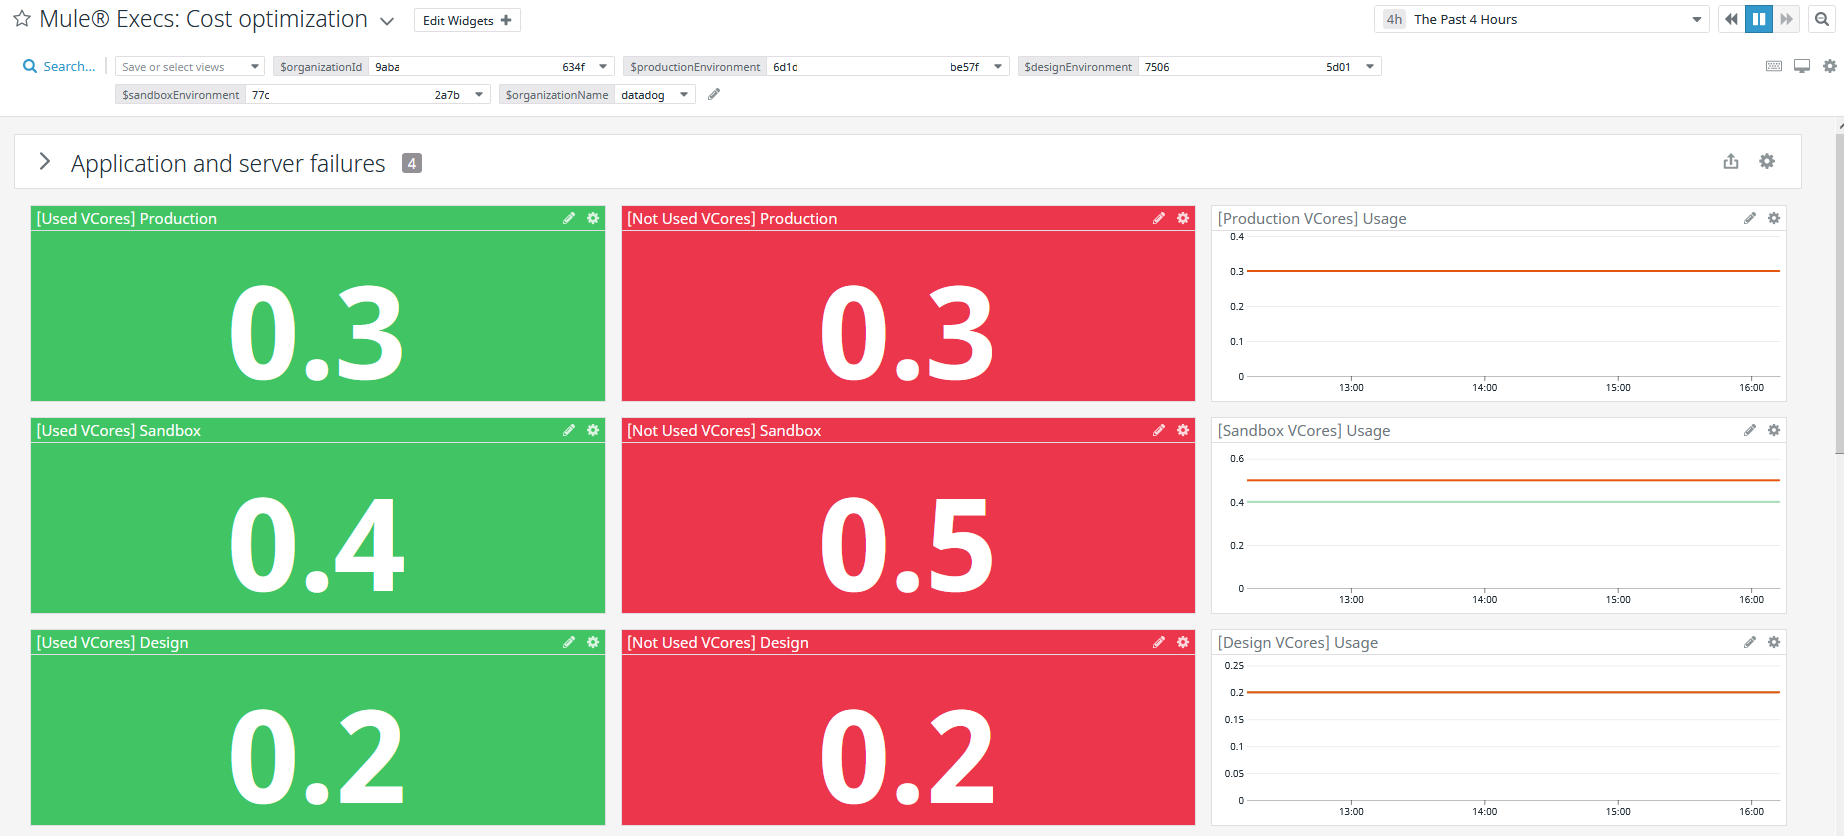
Execs: Cost Optimization
This dashboard monitors the resources available and not available through time per organization, helping you to identify how are being used easily.
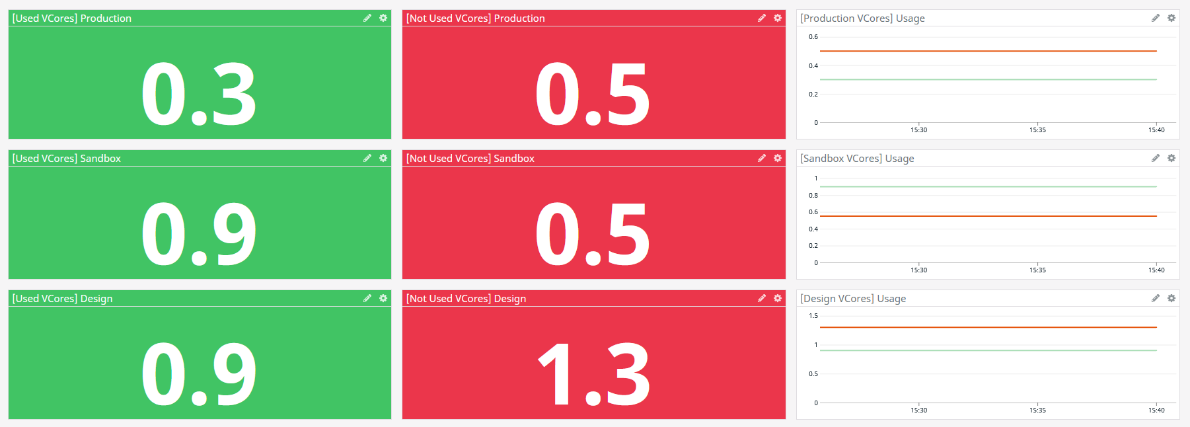
The first section Application and Server failures shows critical and sensitive information about all the infrastructure:
- Applications stopped time.
- Applications stopped TOP 10 list.
- Applications error On-Premise.
- Applications errors On-Premise TOP 10 list.
The next section presents the usage of the following resources:
- vCores.
- VPNs.
- VPCs.
- Static IPs.
- Load Balancers.
- Premium Connectors.
- Object Store.
The information is displayed as values with its own timeline graphic, showing the values through time:
Those widgets work by selecting the time range and the right variables located at the top:

Pro-tip: Configure the MuleSoft organization and environment identifiers and save the view. See how you can obtain the identifiers and save the view in the Datadog dashboard in the pre-requisites.
By default, the dashboard uses and shows the information of all the organizations and environments (*) in your MuleSoft organization. To bring the information of a specific organization and environment, change the values with the correct Ids and change the time range as needed:
Operations: Infrastructure
The dashboard is divided in three sections:
Section 1. Critical: contains alerts that monitor applications critical behavior:
- CloudHub applications stopped
- Servers stopped
- On-Premise application errors
- Queue overload
These widgets are connected to the monitors, they show when the monitors are in Alert, OK or No Data status:
Section 2. CloudHub: shows resource usage by application:
- Memory used
- Memory percentage
- CPU usage
- CPU percentage
- Network in and out
- Message queue and Inflight
Section 3. On-Premise: shows resource usage by target and machine:
- Memory used
- Memory percentage (base 256 MB)
- CPU used
- Network in and out
It works similar to the dashboard mentioned before, you must select the variables values and time range as needed:

Operations: Resources allocation and usage
Pro-tip: Configure the MuleSoft organization and environment identifiers and save the view. See how you can obtain the identifiers and save the view in the Datadog dashboard in the pre-requisites.
This dashboard presents the resources available and used of your infrastructure per main organization.
The dashboard is divided into six sections:
Section 1. Organization vCores:
It displays the VCores assigned and reassigned per organization, also has a subsection that shows:
- vCores used by environments
- vCores reassigned per suborganization
- VPNs usage
- VPCs usage
- Load Balancers usage
- Static IPs usage
Section 2. Resources usage
The next sections include a table that contains resource allocation by organization name, resources reassigned and assigned.
- Organization VPNs
- Organization VPCs
- Organization Load Balancers
- Organization Static IPs
Section 3. Resource re-allocation
Resources from Anypoint Platform in an organization can be reassigned to a sub-organization. The next collapsible sections show how these resources are reassigned to sub-organizations.
Operations: APIs
Pro-tip: Configure the MuleSoft environment, client application and API instance identifiers to organize the views and save it. See how you can obtain the identifiers and save the view in the Datadog dashboard in the pre-requisites.
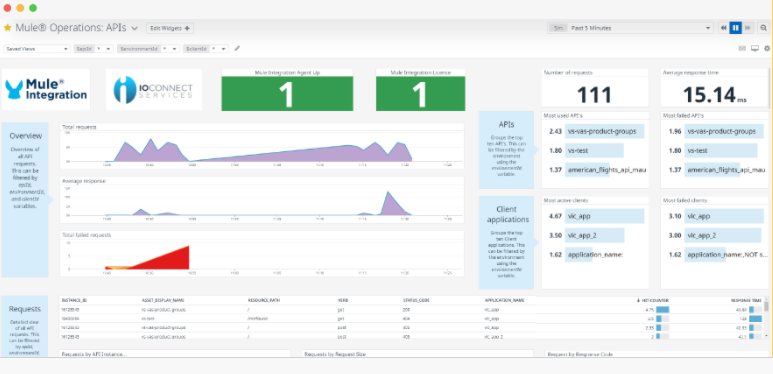
The dashboard is divived into 4 sections:
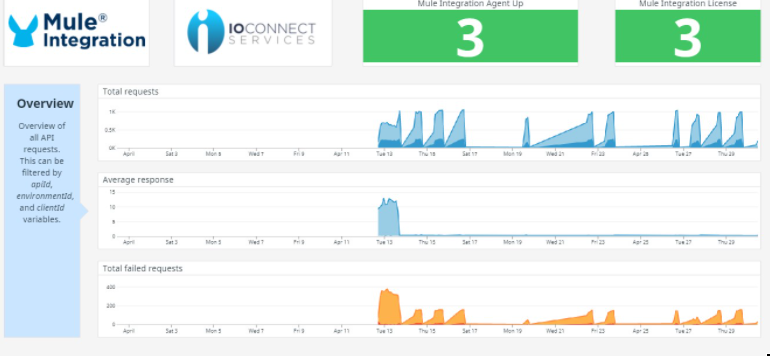
- Overview
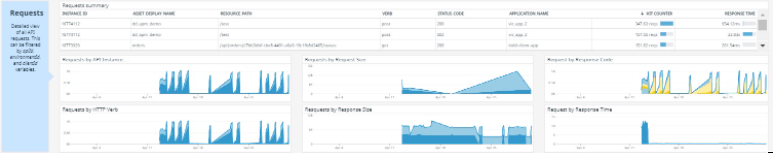
- Requests summary
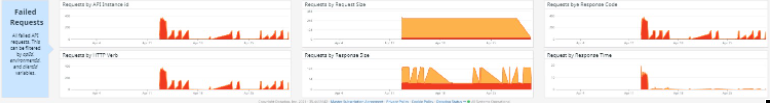
- Failed requests summary
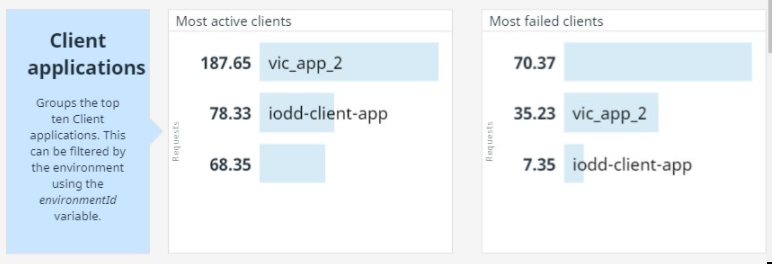
- Top 10
The overview displays a summary of the total of requests, response time and failed requests. Basically it groups the data obtained from the HTTP requests through the Mule event. You can filter out this dashboard by apiId, environment and clientId.
Requests summary section contains the gathered data of the HTTP request organized by different aspects of the HTTP protocol, such as verb, request and response size, code, and time. It also shows a summary of the requests identifying the client application.
The Failed requests summary, it's much the same as the above section, groups the failed request by the metadata of the HTTP protocol.
Final section, it's the Top 10's, here a list of the most used APIs, active clients, failed APIs and clients, is displayed. 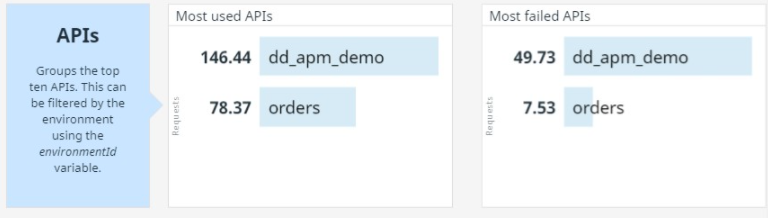
Along with the sections depicted above, the dashboard shows the health of the Datadog Mule Integration and Datadog Agents. Here a full image of how it looks.
Development: Optimizations
The dashboard displays basic information about CloudHub applications and On-Premise servers.
It is divided into CloudHub and On-Premise sections that shows:
- CPU used
- Memory used
- Network in and out
For CloudHub section, you can select it by application and environment, for On-Premise section by target and host:

Monitors
Monitors help to constantly keep track of specific events, triggering an alert or notification whenever such events fulfill a condition. Datadog Mule® Integration comes with pre built-in monitors for events of failures in the Mule applications or servers.
Go to the monitors list by clicking at the side bar:
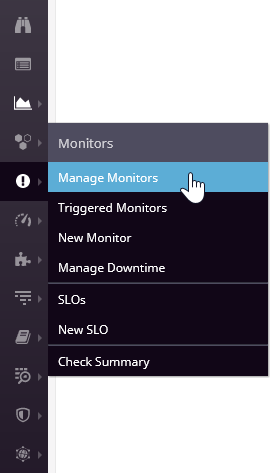
It should be a list like this one:
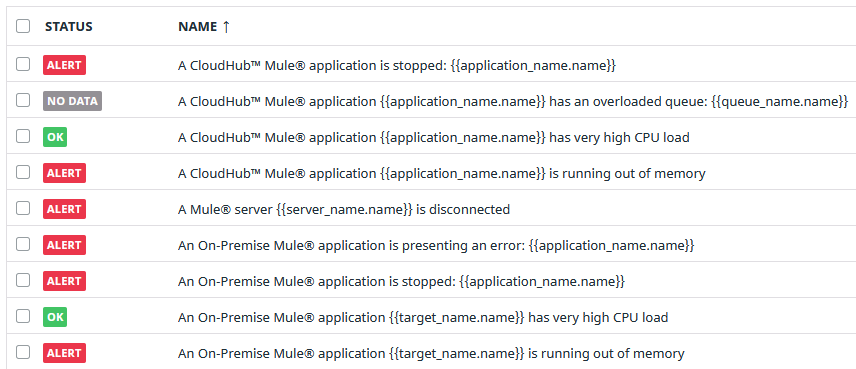
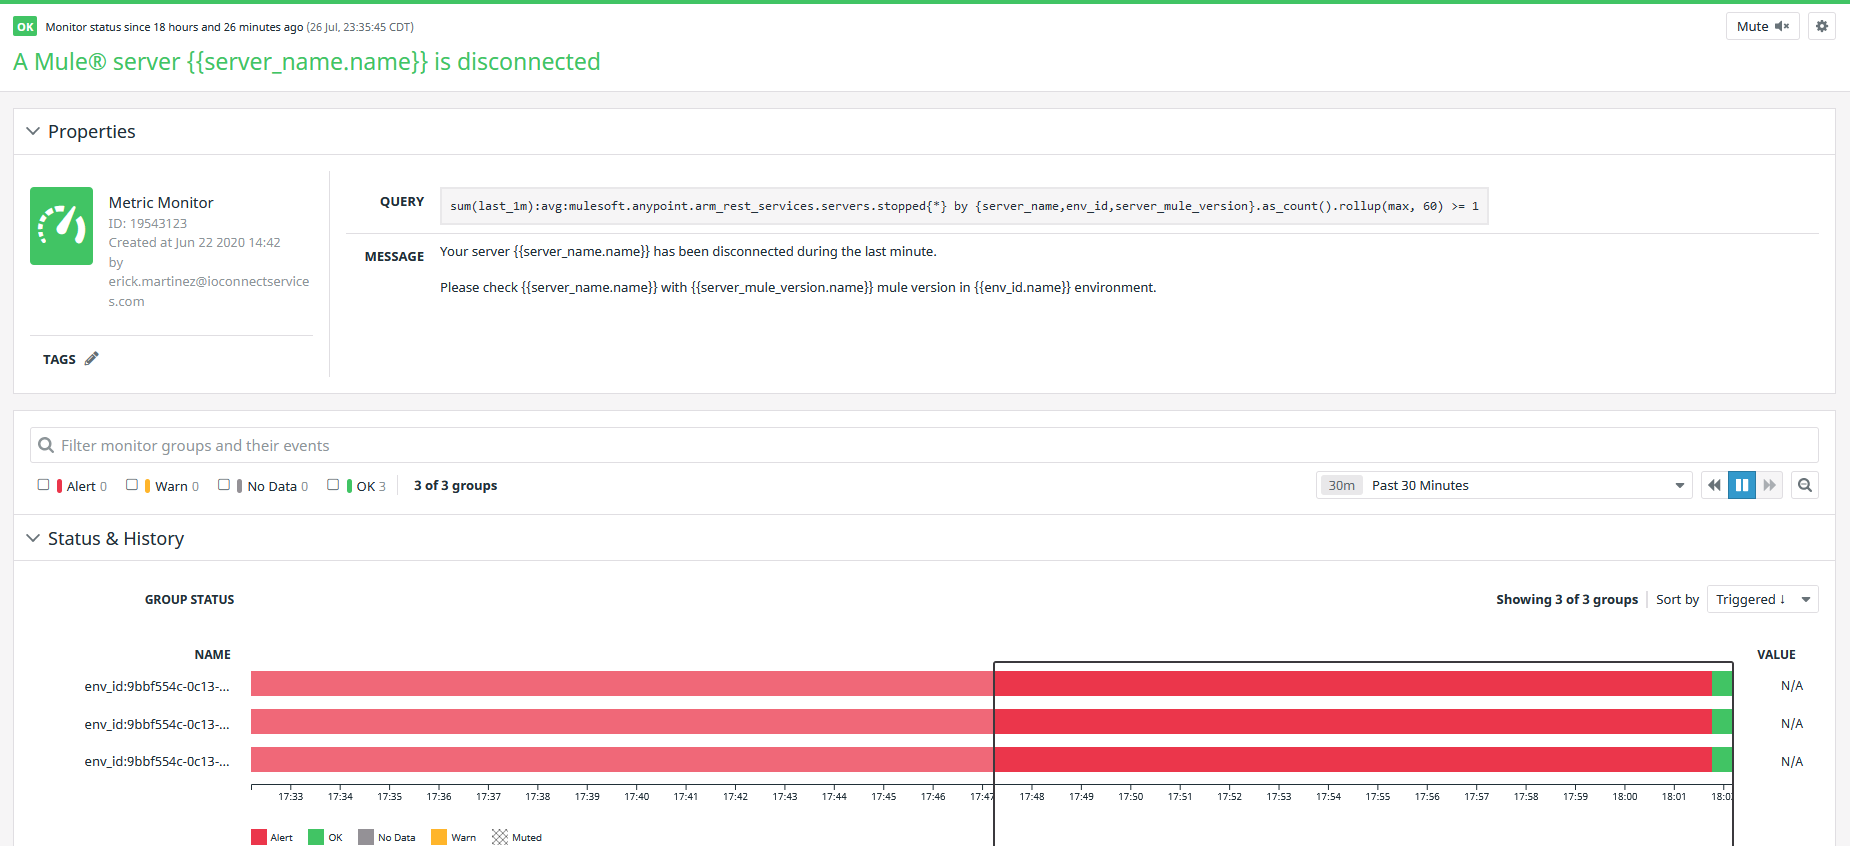
All monitors have the same structure, but each one is configured with specific metrics. The monitor is triggered based on thresholds already set.
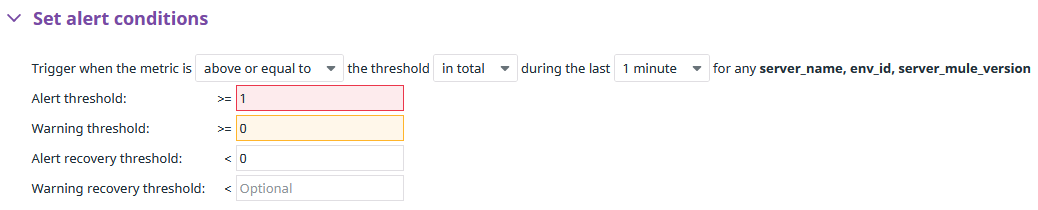
If you open a monitor in the Edit section, you will find the alert threshold value defined by default. This is different for each monitor:
If the alert is triggered, the monitor is going to change to red color, like the image below:
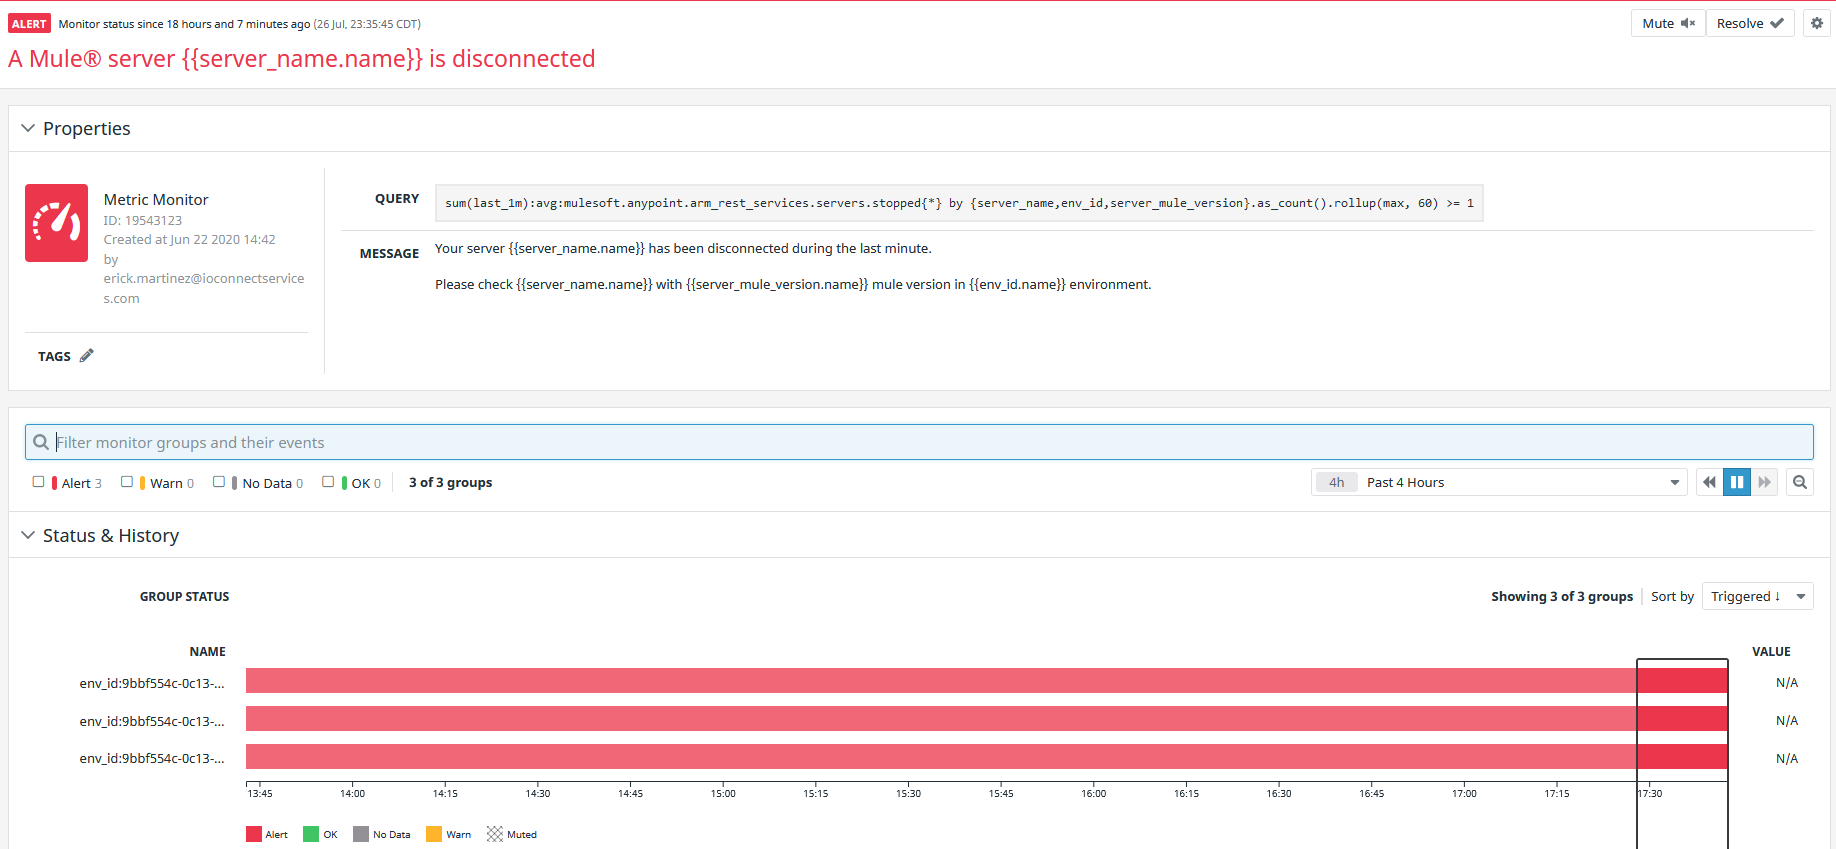
You can indicate in the monitor that the issue is fixed by clicking the Resolve button at the top-right corner, the Alert will change the status to OK and the color from red to green:
Once updated to “Resolve”, the Alert Monitor widget in the dashboards, also will be updated to OK status.
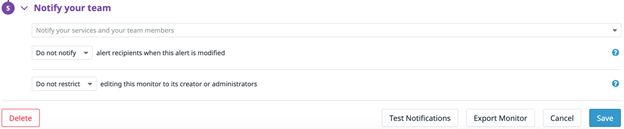
All alerts can be configured to trigger alerts. This is done by configuring the email address, Slack channel or other communication medium that is configured in your Datadog instance. Click on the “Edit” button on the monitor and scroll down to the Notify your team section and configure accordingly.
To learn more about monitors go to https://docs.datadoghq.com/monitors/